
Click on chart(s) to expand
Chart 1

Chart 2

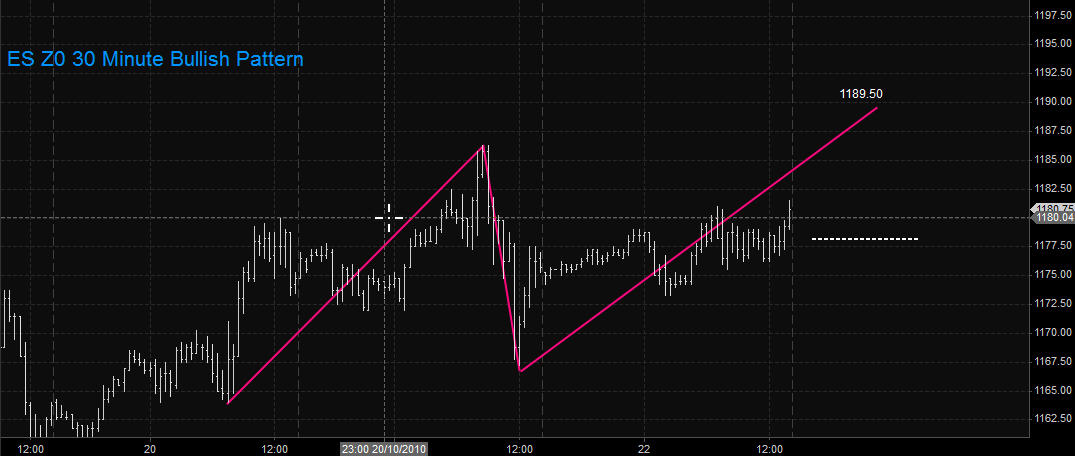
Chart 3
Because the E-Mini S and P trades more hours in a day, it is more accurate to use this for day trading. The SPY is fine for daily analysis, but for intra-day purposes, there are situations and pivots that set up on the overnight futures that SPY cannot track. Chart 1 shows the futures trading slightly above both a shorter-term Andrew's Pitchfork and a longer term pitchfork. Theoretically, the futures should come down to meet the lower line of the longer of the two pitchfork patterns at some point, but would have to breach the pinpoint pivot at 1172 (Chart 2, bearish pattern).
If the pinpoint pivot holds and the ES bounces, we can expect 1178.25 and perhaps as much as 1189.50 (Chart 3).
Of note is that this is the only bearish pattern the ES has right now, not withstanding a pattern dating back to the 30th of April.